This blog post is in no way a tutorial guide, this is me writing this blog post to share my experience of working with React and D3 in a single project.
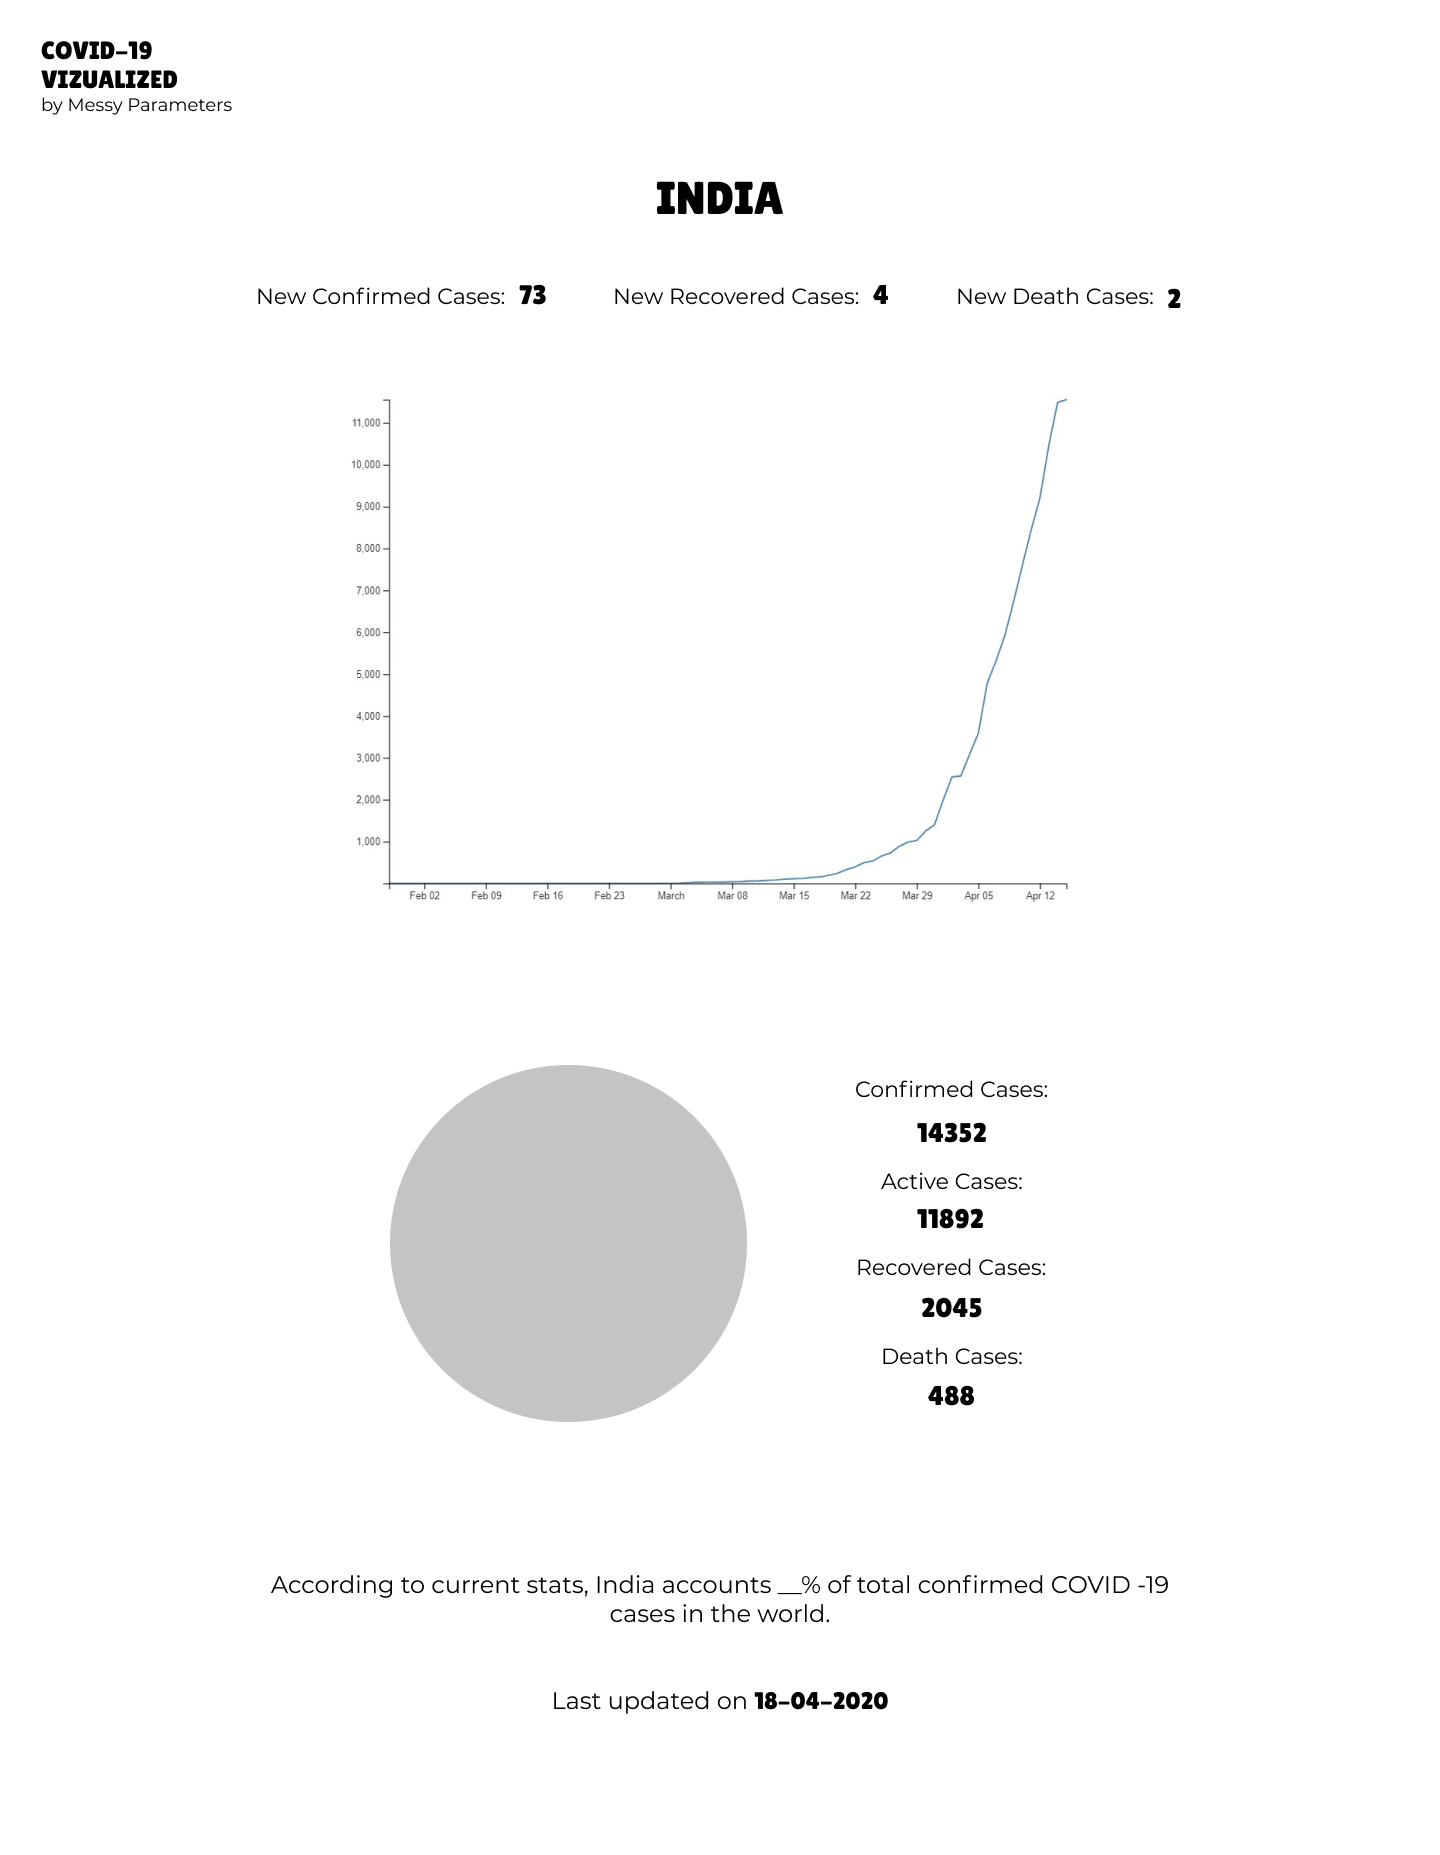
This whole idea of me building my first Data visualization project started because of 2 things: my college and freecodecamp. I was learning React through resources from freecodecamp, and there I found what was a, you guessed it, shining tutorial of D3.js. Also, I had to make a project for college, and what’s a better motivation than a deadline for college assignment. So, I thought of making a visualization for COVID-19 statistics.
Before we begin, if you know about D3.js, you may skip this paragraph, but if you don’t, here’s somethings you should know, D3.js stands for Data Driven Documents, and is a Data Visualization library for JavaScript, that helps you create Data Visualizations with both SVG elements and HTML Canvas. It provides you with a set of functions that help you perform calculations related to the visualization while also helping you to create beautiful and interactive visualizations.
The beginning then:
So, after I decided that I’m going to build the data visualizations, it was time to choose the stack. This was the most obvious choice for me, since I was learning React, I thought of using React alongside D3.js. The idea was to use React for rendering DOM elements and D3.js for the calculations. Interesting?
create-react-app:
But before diving in, I needed to sort a couple of things:
first being the overall design of the website, I took a very minimalistic approach with the design, which in turn helped me making everything responsive. Honestly speaking, uhh, writing, I didn’t know that keeping things minimalist will help me like this.
next thing, the source of data, I looked at couple of open APIs for that, and at last settled for one provided at https://about-corona.net/.
lastly, what I needed was more knowledge about what I was doing. That’s when I found about Shirley Wu, who, as she calls herself, is an Independent Creator for Data Visualizations, through one of her talks and later learned more about D3.js through The Coding Train (awesome channel! highly recommended) channel on YouTube, where she was the guest teacher.
npm start:
the part we all have been waiting for!!
After I was done with the design, and skimming through the internet for tutorials and the API, now was the time to build our visualization. As most react developers do, I started out my project with the create-react-app boiler plate. Besides, React and D3, I was also excited about Styled Components, which I used instead of plain old CSS for this project.
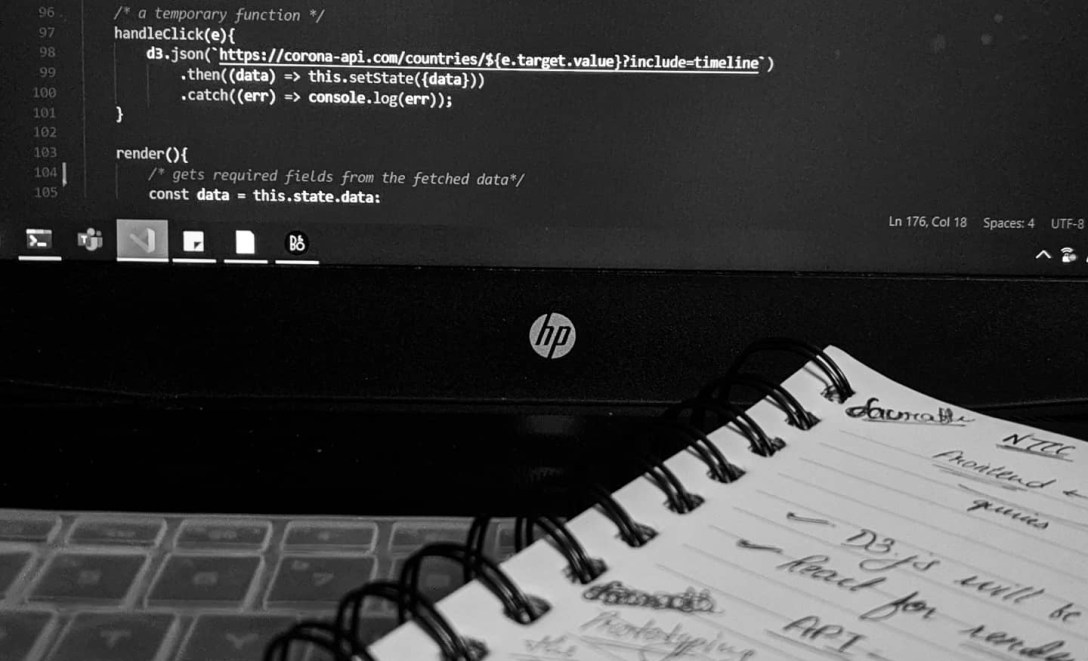
Okay now on to the important stuff, how are we using React and D3 together in my case? As we know, React is a frontend framework, which handles the rendering for us, I intended to use React for rendering the SVG components and D3 for the calculations. But, that doesn’t mean that you can’t use D3 to render visualizations, you could, that’s the whole point of D3, it’s a standalone library to create visualizations. But in my case, I wanted to use React, because it helps in simplifying the code, brings modularity and takes away the problem of manually re-rendering everything.
So, what did I sacrifice for the price for React? Well, in my case, I mostly sacrificed the transitions and the animations for visualizations, that comes with D3, because for that, we need D3 to render the components, which in turn, would have made me manually update the visualizations anytime the data changed.
I only have to render the axes of graphs through D3, because as of now there’s simply no other way to generate axes.
renderer () {
    return (
        <svg width='500' height='500'>
            <g ref={this.xAxis}></g>
            <g ref={this.yAxis}></g>
            <path d={/*calculated d attribute for path */} stroke='black'></path>
        </svg>
    );
}
So, my render() function in react ended up looking something like the code above, but slightly more messier😅 Using D3, I calculated the ‘d’ attribute for the Path element, which defined the path to be drawn. And as I mentioned before, I had to render the axes using d3, but since react uses Virtual DOM, I had to create references for d3 using ref attribute. You can read more about ref here.
npm react-app build:
next step was to build and deploy, for that I used our trusted Netlify. I linked my visualization GitHub repository, with netlify for automatic deployment, as soon as I push new changes! Currently the project is still in development, and the repository is Private. I’ll make it public soon!
Checkout the live project here.
Currently, it shows data for India only, but a search feature for countries coming soon!
I know this post doesn’t cover the whole story of the project, but what it does is that it covers a key aspects of the project and tells you about somethings I learned about using D3 and React together.
RESOURCES
1. COVID-19 stats API
2. freecodecamp
3. Shirley Wu’ Video with The Coding Train
4. Shirley Wu’s Talk
5. Learn more about D3 from here.
6. refs in react
The resources from freecodecamp are enough to get you started with a particular topic, but you should definitely definitely read documentations and watch videos and tutorials to learn more about it.
I hope you all stay safe during this Quarantine. Take care! Peace!

Cool Project!
LikeLike